| Causes of Death | 2018 | 2019 | 2019 % |
| Healthcare and lifestyle related causes | 43,075,357 | 44,103,948 | 81.1% |
| Nutrition and absence of basic healthcare | 7,250,058 | 7,079,553 | 13.0% |
| Road injuries | 1,196,641 | 1,198,289 | 2.2% |
| Mental disorders incl. self harm | 794,381 | 797,609 | 1.5% |
| Interpersonal violence | 420,305 | 415,180 | 0.8% |
| Accidental (Fire, Poisoning or Drowning) | 390,097 | 387,115 | 0.7% |
| Substance abuse | 288,673 | 296,098 | 0.5% |
| Terrorism | 103,496 | 62,985 | 0.1% |
| Environmental | 57,396 | 53,537 | 0.1% |
| TOTAL | 53,576,403 | 54,394,314 |
81% of deaths globally is caused by healthcare and lifestyle related illnesses. The second largest factor at 12% is due to malnutrition, absence of basic sanitation and healthcare. So 94% or a total of 50 million deaths out of 54 million global deaths are WASH (Water, Sanitation and Hygiene) and health related. But somehow global investments into public healthcare tell a different story to the mortality numbers. This is not because the investors are insensitive to the facts, but because they are reliant on a few established data points to measure investment productivity that do not paint the full picture. In this blog I attempt to tell a story through the contradictions data can throw when juxtaposed . I start with the leading causes of global mortality and contrast it through the prism of various other data points.
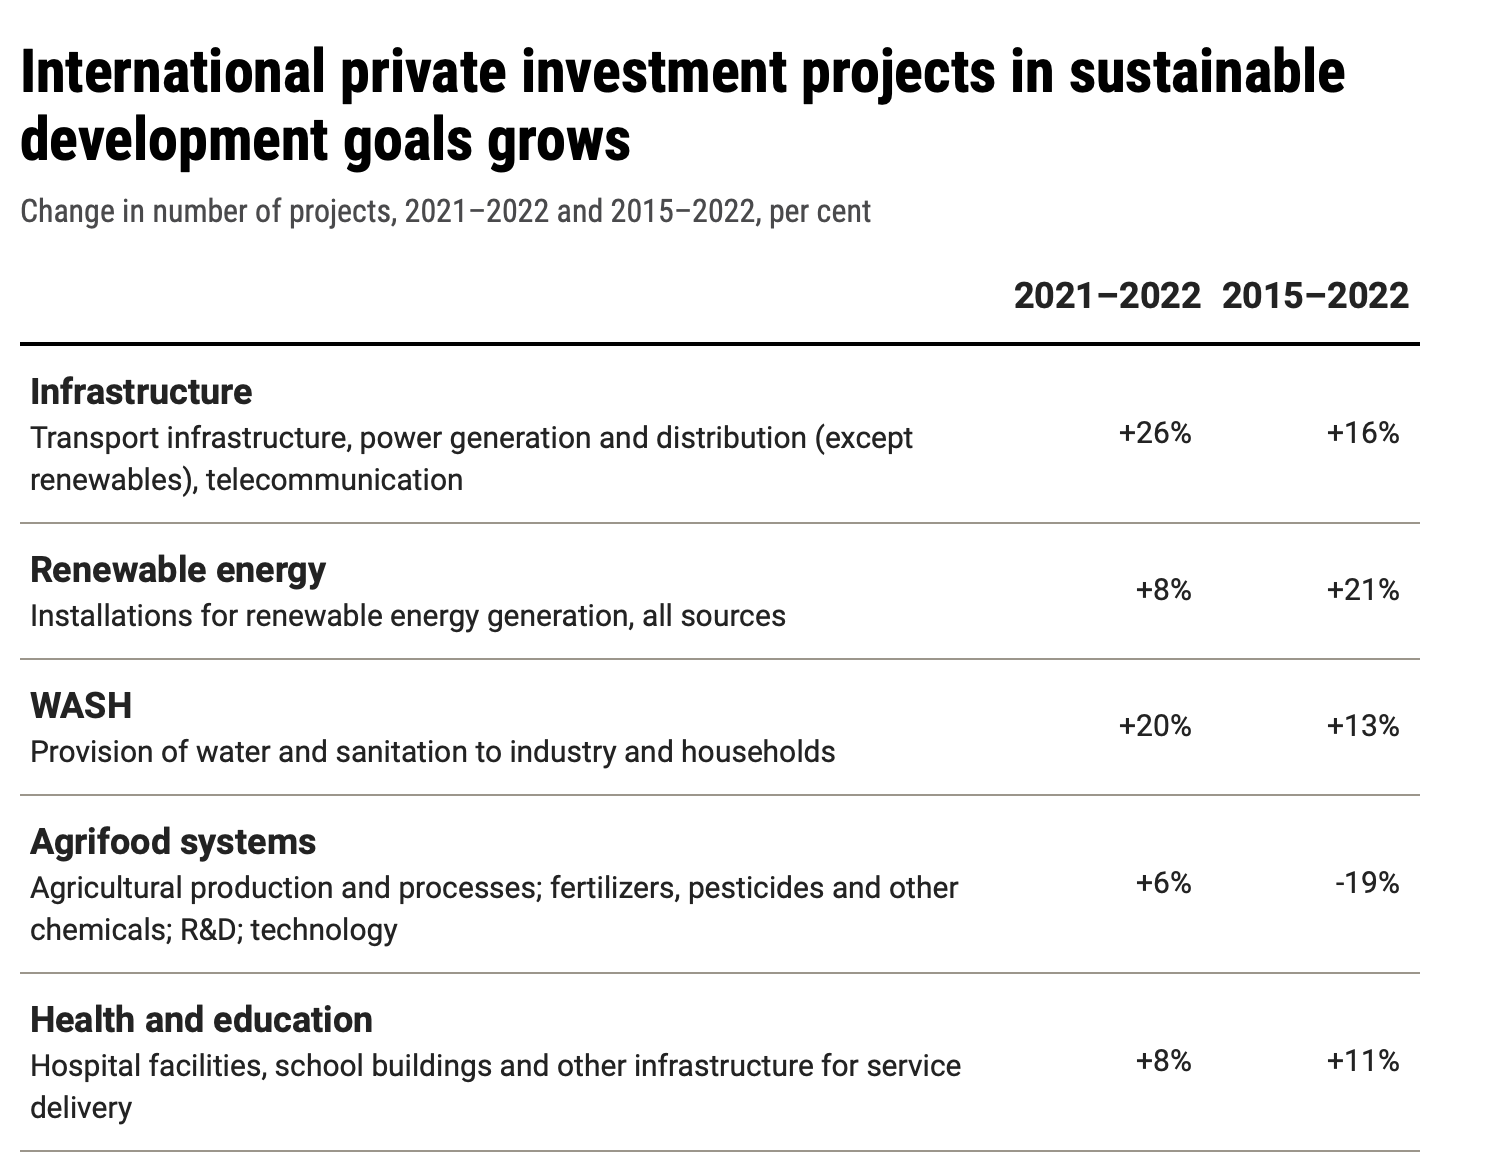
In the above table, the number one growth in global private sustainable investments is in physical infrastructure, followed by WASH, this is in line with the fact that WASH contributed to 3.4 million or 6.3% of the annual deaths. Third on the list at 8% growth, is renewable energy and investments into human capital (healthcare and education) , however both were lower by -13% and -3% respectively since 2015. When more than 82% of the global deaths are health related, one wonders why healthcare is ranked fourth amongst the five listed sustainable investments growth numbers?
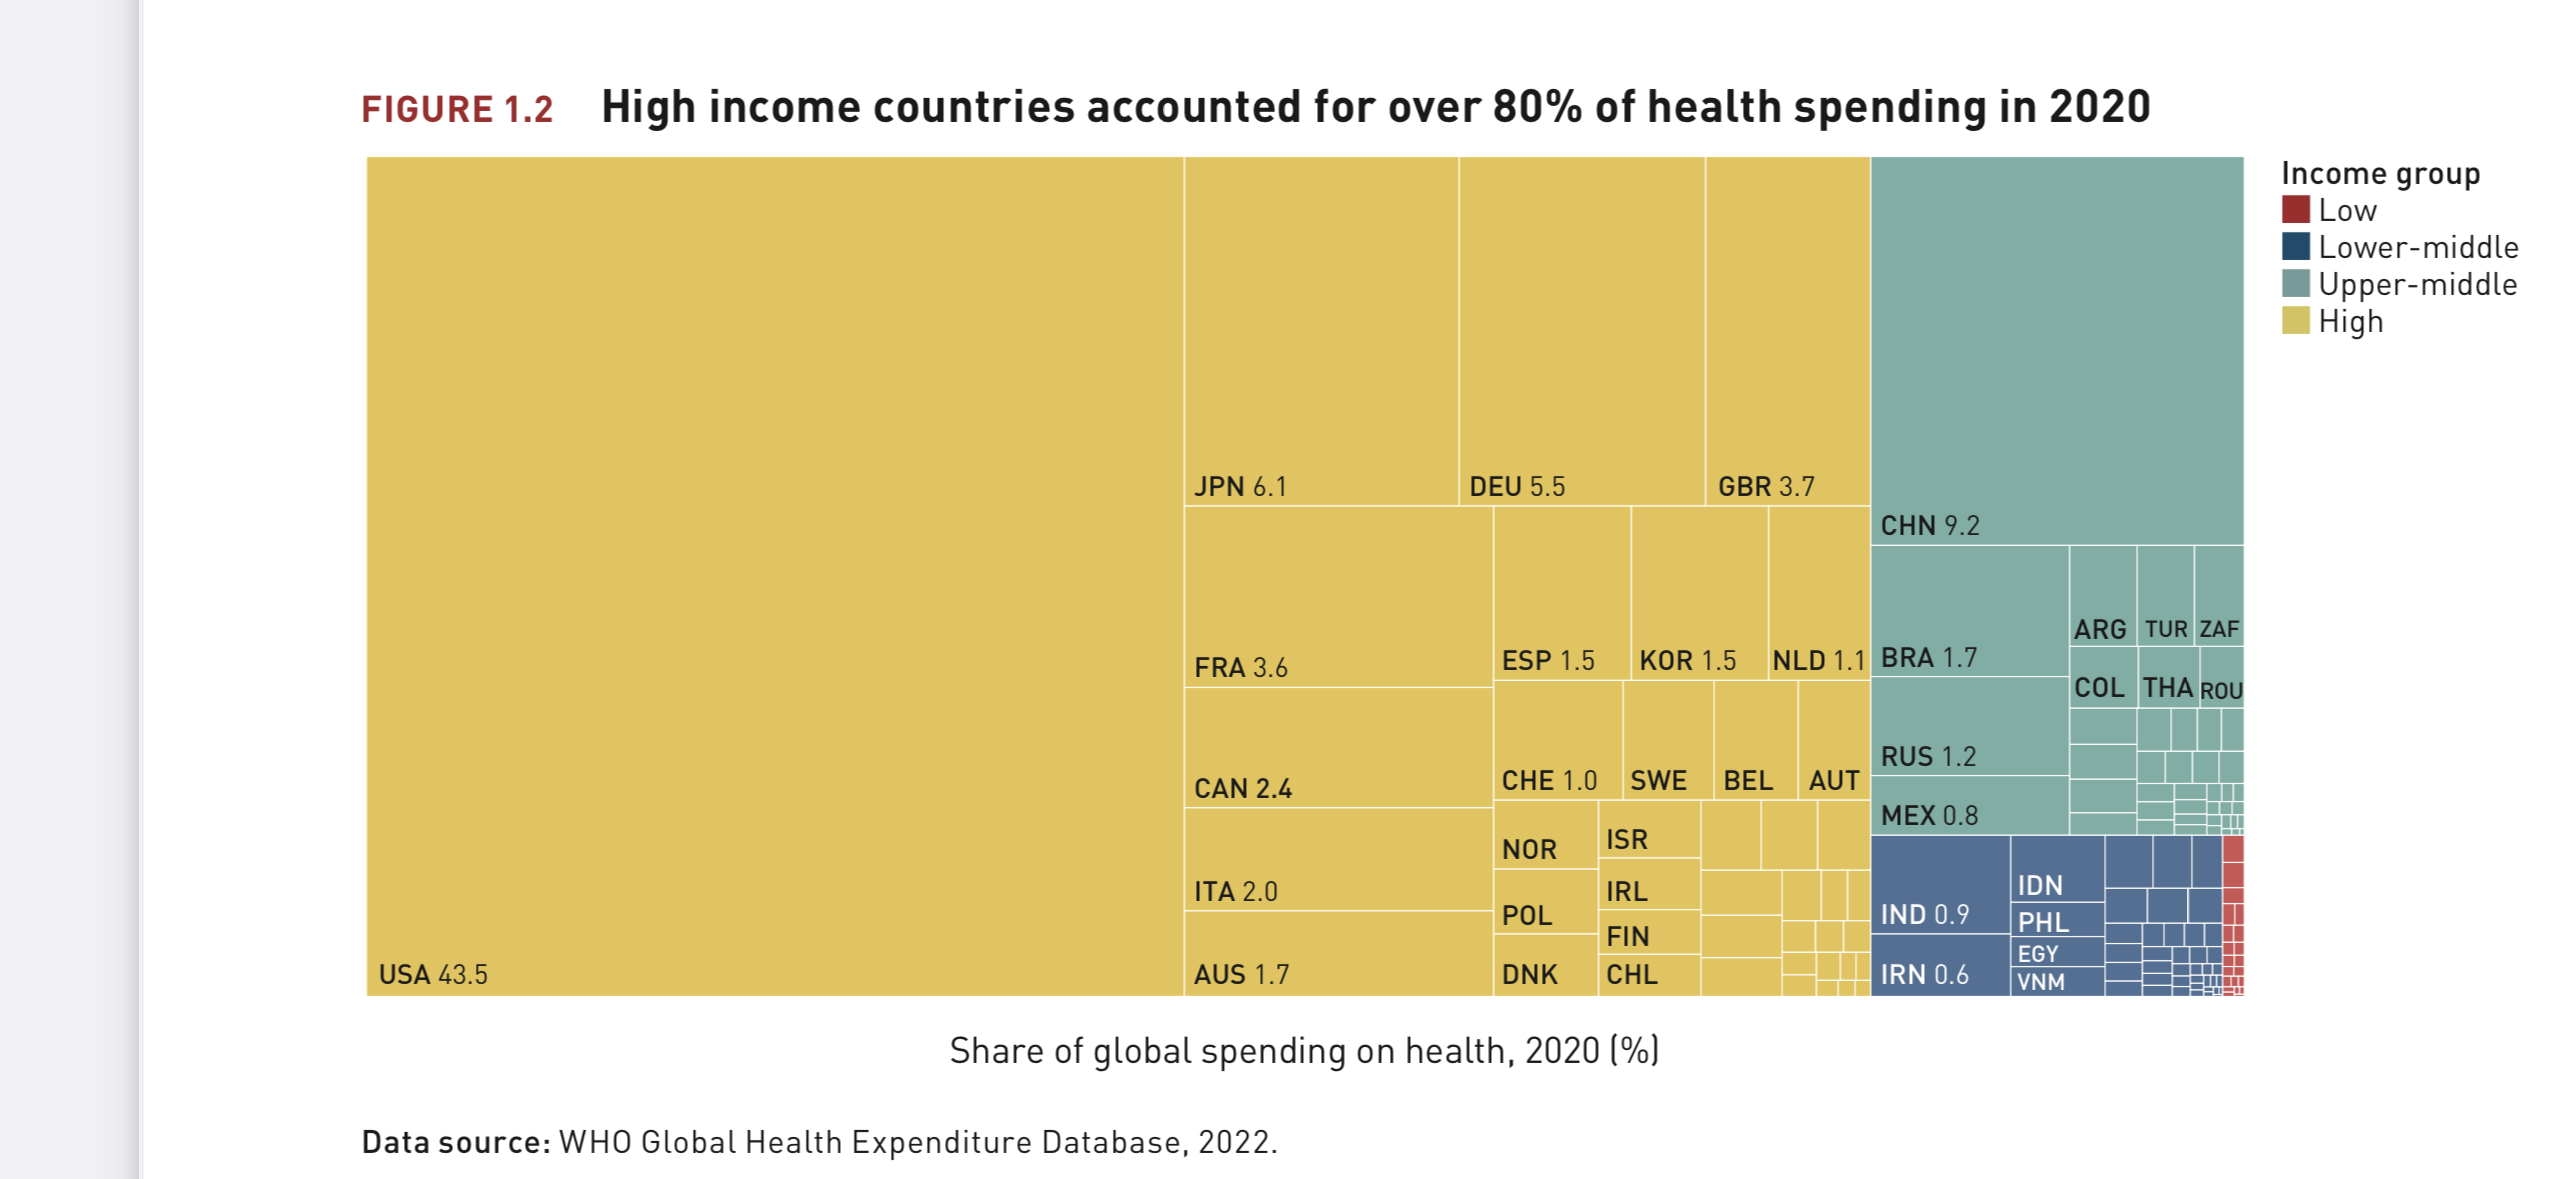

The two charts above show, China and India when combined account for 36% of the global population, but only account for 10.4% of the global healthcare spends, 3-4 times its share of spends. The below table shows, India and China account for 36% of global health related deaths the highest by far, 3-4 times higher than the next highest nation, which is United States at 4.83%. United States spends 43.5% of global healthcare expenditure, almost 10 times its share of global deaths.
| Country | Healthcare spend | Per Capital Healthcare spends | Defence spends | Health over Defense | Avg. Age in yrs | %health related deaths |
| United States | $ 3.9 tn | $ 11,795,722 | $801bn. | 4x | 38.1 | 4.83 |
| China | $ 828 bn | $ 586,402 | $209bn. | 3x | 48.4 | 20.31 |
| Japan | $ 5.49tn | $ 43,675,418 | $ 54bn. | +100x | 44.7 | 2.43 |
| Germany | $ 495 bn | $ 5,949,519 | $ 56 bn. | 8x | 39.0 | 1.66 |
| India | $ 81 bn | $ 57,528 | $77bn. | 6% | 28.2 | 15.96 |
The above table shows Japan, with an aging population, spends over 100 times its defence expenditure on healthcare, despite accounting for only 2.43% of global health related deaths. India a much younger nation, with an average age of 28.2 years, accounts for 16% of global health related deaths, yet spends only 0.9% of global healthcare expenditure. The contradictions are not just with one nation, the world spends almost 3% of its GDP on defence, however armed conflicts and terrorism only account for 0.02% of global death.
India’s services sector accounts for over 50% of its GDP, therefore its priority must be to invest into its human capital. Yet, India spends 21.5% of its total expenditure on physical infrastructure as against 13.5% on healthcare. In per capita terms healthcare is a meagre $57,528, even on a PPP basis that amounts to $200,000, which is fraction of a high income economy’s per capita healthcare expenditure. To reverse its mortality trend, India must invest at least 3 times its current per capita healthcare expenditure.
The world spends $2.86tn annually on automobile purchases, as against $1.8tn on public transport, even though road related deaths are the third highest cause of global mortality. Shouldn’t nations worldwide double investments into public transport over growing automobile sales?
Is 2% of healthcare spends adequate for mental health, when 1.2m deaths a year are caused by mental illness, suicide and deaths on account of interpersonal violence? The answer to this question lies in another question. When there is an increase in crime related deaths, should governments invest in prisons, arms and police force or in family welfare and mental health? The former delivers measurable results but after someone is killed, the later is preventive and can only be measured in aggregate trends.
While there are several other such contradictions, my intent is to highlight, there is no single absolute measure to prioritise investments towards long-term economic value creation, and in some cases, may result in unintended liabilities. So often its not a matter of a single data point but the story several related datasets reveal when juxtaposed.
A recent WHO study published to promote investments into public healthcare found, the net present value of WHO costs over the next 10-years starting 2022, is US$ 33 billion and the public value created as a result of this investment, in the most conservative estimation possible, is likely to be between US$ 1.155 trillion and US$ 1.46 trillion. The resulting return on investment is at least US$ 35 for every US$ 1 invested in WHO. In light of the direct economic costs of the COVID-19 pandemic, the WHO report aims to bring greater measurability to the return on public healthcare investments. Hopefully, this data tells a different story, urging nations to invest in the worlds most valuable asset over all others, human capital.
