| 18+ Population | 15-18 Years | 12-14 Years | Total | % coverage | ||||||||
| States | 2011 Census | 2023 estimates | First Dose | Second Dose | First Dose | Second Dose | First Dose | Second Dose | First Dose | Second Dose | 1st | 2nd |
| Uttar Pradesh | 199,812,341 | 235,687,000 | 154,095,846 | 147,866,306 | 14,193,592 | 13,227,385 | 8,709,558 | 7,875,689 | 176,998,996 | 168,969,380 | 75% | 72% |
| Maharashtra | 112,374,333 | 126,385,000 | 84,661,742 | 71,648,227 | 4,118,955 | 3,108,682 | 2,890,917 | 1,870,154 | 90,650,851 | 76,627,063 | 72% | 61% |
| Bihar | 104,099,452 | 126,756,000 | 62,956,600 | 59,160,909 | 6,240,650 | 5,348,480 | 4,287,694 | 3,402,633 | 72,599,883 | 67,912,022 | 57% | 54% |
| West Bengal | 91,276,115 | 99,084,000 | 67,305,205 | 61,606,655 | 3,599,971 | 3,041,518 | 2,622,439 | 2,059,332 | 72,964,508 | 66,707,505 | 74% | 67% |
| Madhya Pradesh | 72,626,809 | 86,579,000 | 54,143,721 | 54,060,575 | 4,194,620 | 3,472,819 | 2,410,931 | 1,698,646 | 60,036,987 | 59,232,040 | 69% | 68% |
| Tamil Nadu | 72,147,030 | 76,860,000 | 56,670,420 | 53,531,488 | 2,627,711 | 2,223,999 | 1,917,091 | 1,465,184 | 60,763,315 | 57,220,671 | 79% | 74% |
| Rajasthan | 68,548,437 | 81,025,000 | 51,115,135 | 46,586,572 | 3,576,021 | 2,955,024 | 2,343,913 | 1,496,698 | 56,187,854 | 51,038,294 | 69% | 63% |
| Karnataka | 61,095,297 | 67,692,000 | 50,032,618 | 50,520,626 | 2,816,420 | 2,719,838 | 2,325,231 | 2,150,764 | 54,999,802 | 55,391,228 | 81% | 82% |
| Gujarat | 60,439,692 | 71,507,000 | 49,324,313 | 49,447,677 | 3,131,882 | 2,906,669 | 1,941,553 | 1,677,781 | 54,133,976 | 54,032,127 | 76% | 76% |
| Andhra Pradesh | 49,386,799 | 53,156,000 | 40,645,526 | 43,555,676 | 2,535,340 | 2,527,612 | 1,523,365 | 1,495,439 | 44,676,305 | 47,578,727 | 84% | 90% |
| Odisha | 41,974,218 | 46,276,000 | 31,454,213 | 29,961,026 | 2,195,557 | 1,844,429 | 1,600,986 | 1,206,659 | 34,856,429 | 33,012,114 | 75% | 71% |
| Telangana | 35,193,978 | 38,090,000 | 29,616,147 | 29,076,321 | 1,724,039 | 1,582,381 | 1,107,427 | 901,148 | 32,241,334 | 31,559,850 | 85% | 83% |
| Kerala | 33,406,061 | 35,776,000 | 27,017,012 | 23,802,666 | 1,322,835 | 957,260 | 810,940 | 511,968 | 28,851,815 | 25,271,894 | 81% | 71% |
| Jharkhand | 32,988,134 | 39,466,000 | 21,309,985 | 16,109,631 | 1,596,094 | 1,125,341 | 1,062,598 | 622,621 | 23,528,700 | 17,857,593 | 60% | 45% |
| Assam | 31,205,576 | 35,713,000 | 22,550,940 | 20,575,568 | 1,262,520 | 972,402 | 999,552 | 602,283 | 24,415,743 | 22,150,253 | 68% | 62% |
| Punjab | 27,743,338 | 30,730,000 | 22,360,873 | 19,620,593 | 1,117,484 | 878,039 | 684,133 | 497,386 | 23,975,743 | 20,996,018 | 78% | 68% |
| Chhattisgarh | 25,545,198 | 30,180,000 | 18,956,636 | 18,537,789 | 1,234,989 | 1,053,337 | 1,076,059 | 752,555 | 20,944,180 | 20,343,681 | 69% | 67% |
| Haryana | 25,351,462 | 30,209,000 | 21,963,025 | 18,749,437 | 1,158,491 | 771,866 | 559,813 | 327,582 | 23,449,098 | 19,848,885 | 78% | 66% |
| Delhi | 16,787,941 | 21,359,000 | 16,604,293 | 14,355,694 | 1,008,906 | 870,754 | 683,552 | 490,316 | 18,103,515 | 15,716,764 | 85% | 74% |
| Jammu & Kashmir | 12,258,433 | 13,603,000 | 9,942,689 | 10,388,567 | 876,048 | 861,731 | 553,844 | 517,818 | 11,336,555 | 11,768,116 | 83% | 87% |
| Uttarakhand | 10,086,292 | 11,637,000 | 8,183,313 | 7,949,220 | 532,980 | 467,834 | 402,311 | 315,985 | 9,032,278 | 8,733,039 | 78% | 75% |
| Himachal Pradesh | 6,864,602 | 7,468,000 | 6,042,660 | 5,783,693 | 331,826 | 309,613 | 272,064 | 235,002 | 6,609,488 | 6,328,308 | 89% | 85% |
| Tripura | 3,673,917 | 4,147,000 | 2,659,018 | 2,328,968 | 144,833 | 115,278 | 112,965 | 79,612 | 2,883,463 | 2,523,858 | 70% | 61% |
| Meghalaya | 2,966,889 | 3,349,000 | 1,332,367 | 1,025,429 | 77,132 | 42,844 | 37,364 | 19,512 | 1,429,011 | 1,087,785 | 43% | 32% |
| Manipur | 2,855,794 | 3,223,000 | 1,464,399 | 1,226,336 | 109,652 | 68,555 | 75,418 | 44,329 | 1,618,380 | 1,339,220 | 50% | 42% |
| Nagaland | 1,978,502 | 2,233,000 | 837,969 | 684,747 | 59,974 | 40,347 | 26,012 | 19,889 | 917,832 | 744,983 | 41% | 33% |
| Goa | 1,458,545 | 1,575,000 | 1,355,046 | 1,224,544 | 51,734 | 44,551 | 33,265 | 26,640 | 1,433,420 | 1,295,735 | 91% | 82% |
| Arunachal Pradesh | 1,383,727 | 1,562,000 | 861,396 | 748,505 | 59,100 | 44,869 | 40,852 | 28,445 | 948,941 | 821,819 | 61% | 53% |
| Puducherry | 1,247,953 | 1,646,000 | 913,046 | 802,234 | 50,694 | 44,614 | 30,873 | 21,251 | 984,991 | 868,099 | 60% | 53% |
| Mizoram | 1,097,206 | 1,238,000 | 785,860 | 669,572 | 60,098 | 47,010 | 48,360 | 33,595 | 879,553 | 750,177 | 71% | 61% |
| Chandigarh | 1,055,450 | 1,231,000 | 1,089,773 | 921,116 | 57,688 | 43,895 | 38,181 | 25,995 | 1,173,456 | 991,006 | 95% | 81% |
| Sikkim | 610,577 | 689,000 | 539,929 | 509,134 | 30,049 | 26,515 | 21,899 | 19,007 | 588,985 | 554,656 | 85% | 81% |
| Dadra & Nagar Haveli and Daman & Diu | 586,956 | 1,263,000 | 730,850 | 595,089 | 31,509 | 26,943 | 19,989 | 14,929 | 777,288 | 636,961 | 62% | 50% |
| A & N Islands | 380,581 | 403,000 | 313,284 | 320,383 | 19,208 | 18,860 | 15,124 | 14,041 | 346,533 | 353,284 | 86% | 88% |
| Ladakh | 274,289 | 300,000 | 219,604 | 187,095 | 10,072 | 9,261 | 8,627 | 7,758 | 237,434 | 204,114 | 79% | 68% |
| Lakshadweep | 64,473 | 69,000 | 56,914 | 56,019 | 2,911 | 2,781 | 1,988 | 1,723 | 61,548 | 60,523 | 89% | 88% |
| 1,210,846,397 | 1,388,166,000 | 920,112,367 | 864,194,087 | 62,161,585 | 53,803,336 | 41,296,888 | 32,530,369 | 1,015,638,190 | 950,527,792 | 73% | 68% | |
I had said in my earlier blog, “What all of this tells us with some near perfect execution and some optimistic modelling India may be able to vaccinate their target age group of 18 and above with a single shot by mid 2022, they may be able vaccinate the total population with the second dose by Mar 2023”. Today as of 26 May 2023, India has managed to vaccinate 73-75% of its population with a first dose and 68% of its population with a second dose.
In my first blog I had said, “To compound matters the state-wise distribution seem inequitable, populous states like Uttar Pradesh has a 51% and Bihar has a 46% under allocation in proportion to their population vs. a state like Gujarat seems to have 75%, or Himachal at 121%.” As of date, Uttar Pradesh has done a stellar job, despite its significant size in population and initial under allocation of vaccines the state managed a 75% first dose coverage. Himachal had an over allocation of vaccines and therefore a head start and as expected 89% of its population got the first jab and 84% second. Bihar with its overall poor track record in HDI (Human Development Index) and an under allocation has performed poorly as expected, with just 57% getting the first shot and 54% the second.
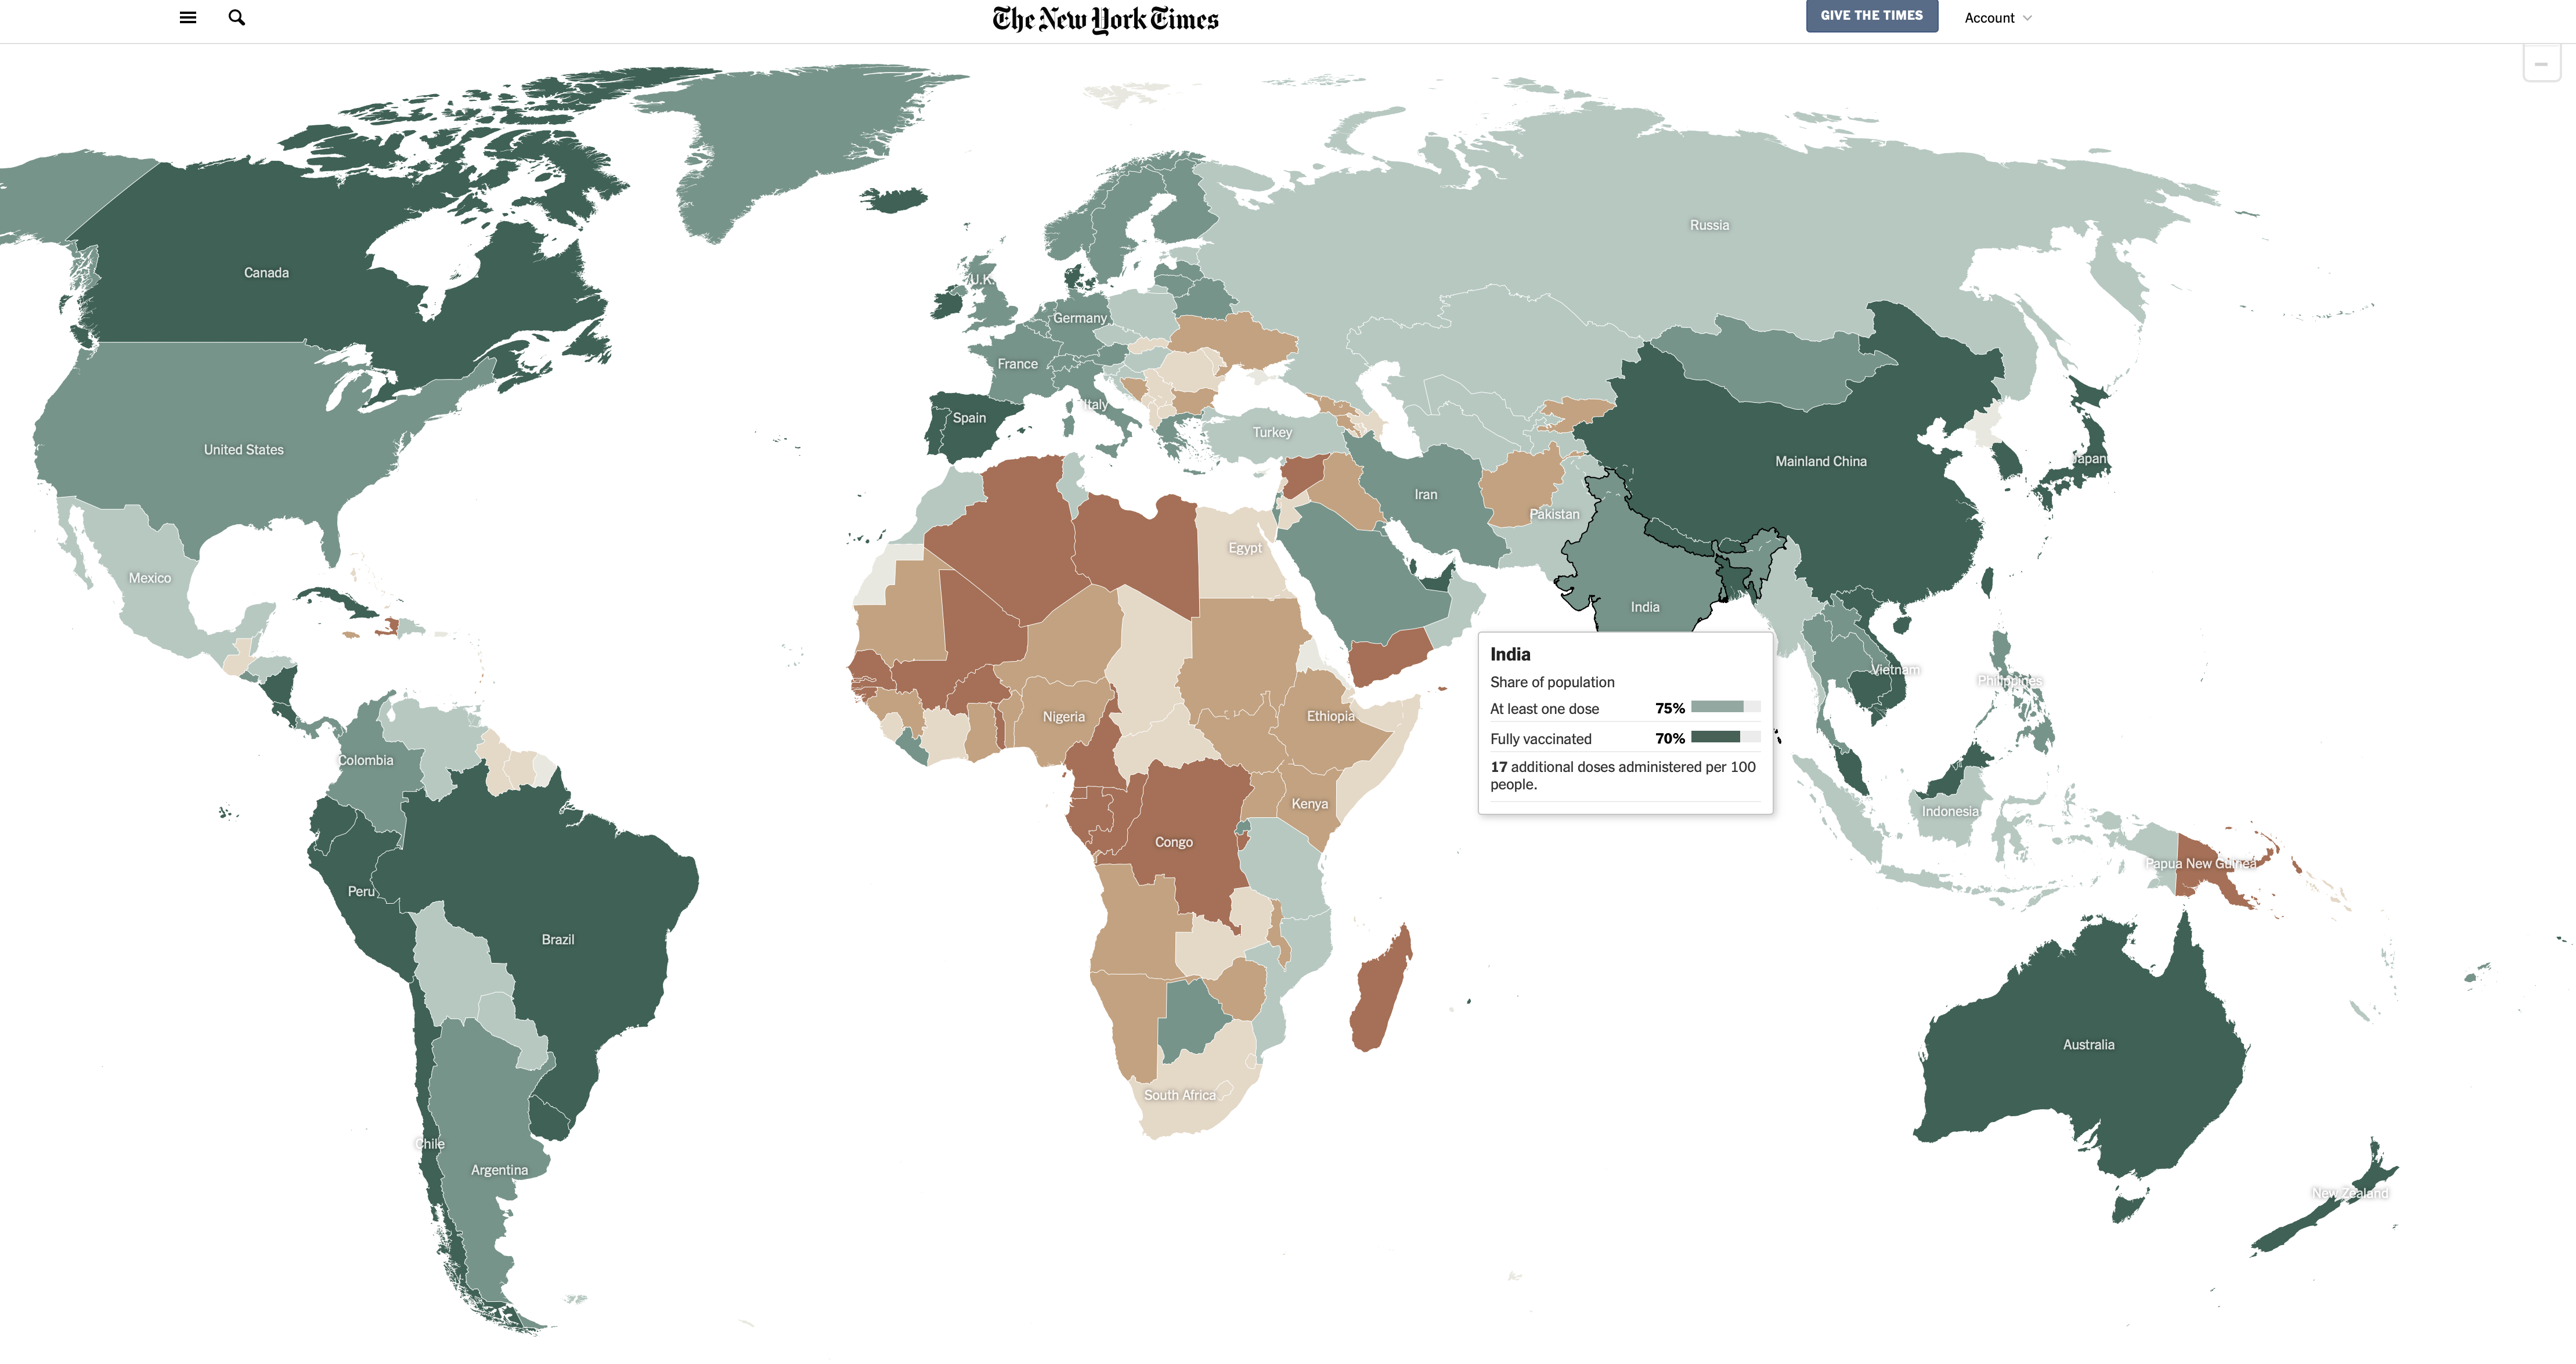
While India is in the green, it is ranked at 64 out of 187 nations in coverage. With 75% of its population getting at least their first does, India is marginally better than the global average of 72%. China has a 94% vaccinated population, any statistic from China has to be taken with a pinch of salt, but let’s just say the country with similar size to India has done significantly better. United States has vaccinated 80% of its population, Indonesia and Pakistan have vaccinated 75% and finally Brazil has vaccinated 90% of their population. The above countries along with India account for over 49% of the world population. So it’s fair to say that India’s report card will read as meets expectation with fair room for improvements.
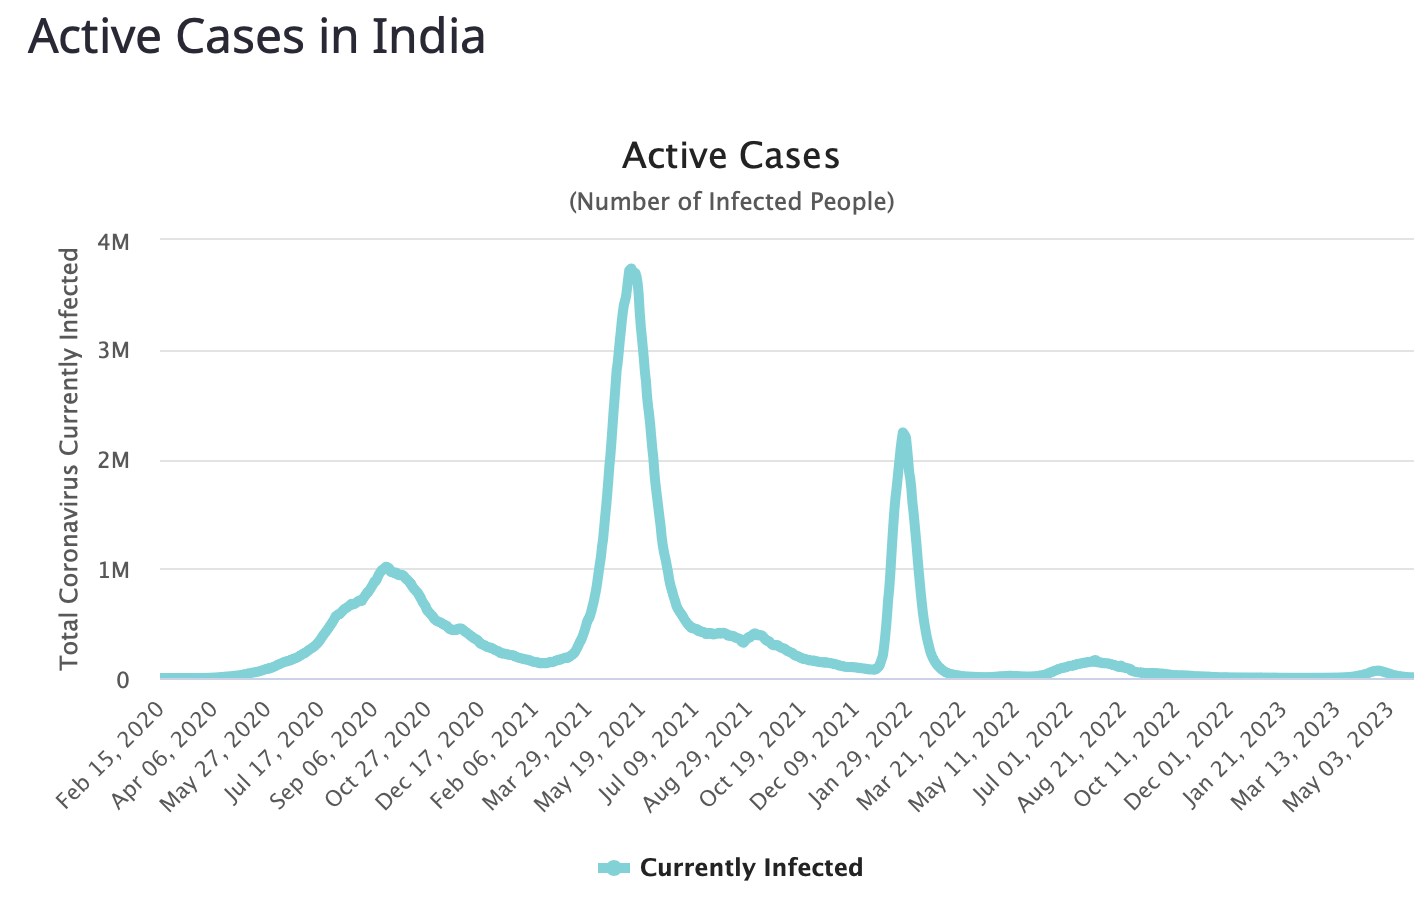
If India is seeing a few minor blips in the active cases graph, it’s largely because of the lower vaccination coverage. One must acknowledge the country has definitely averted a major health crisis with majority of their population getting vaccinated, albeit, not without a few blunders resulting in a significant cost to human lives.
